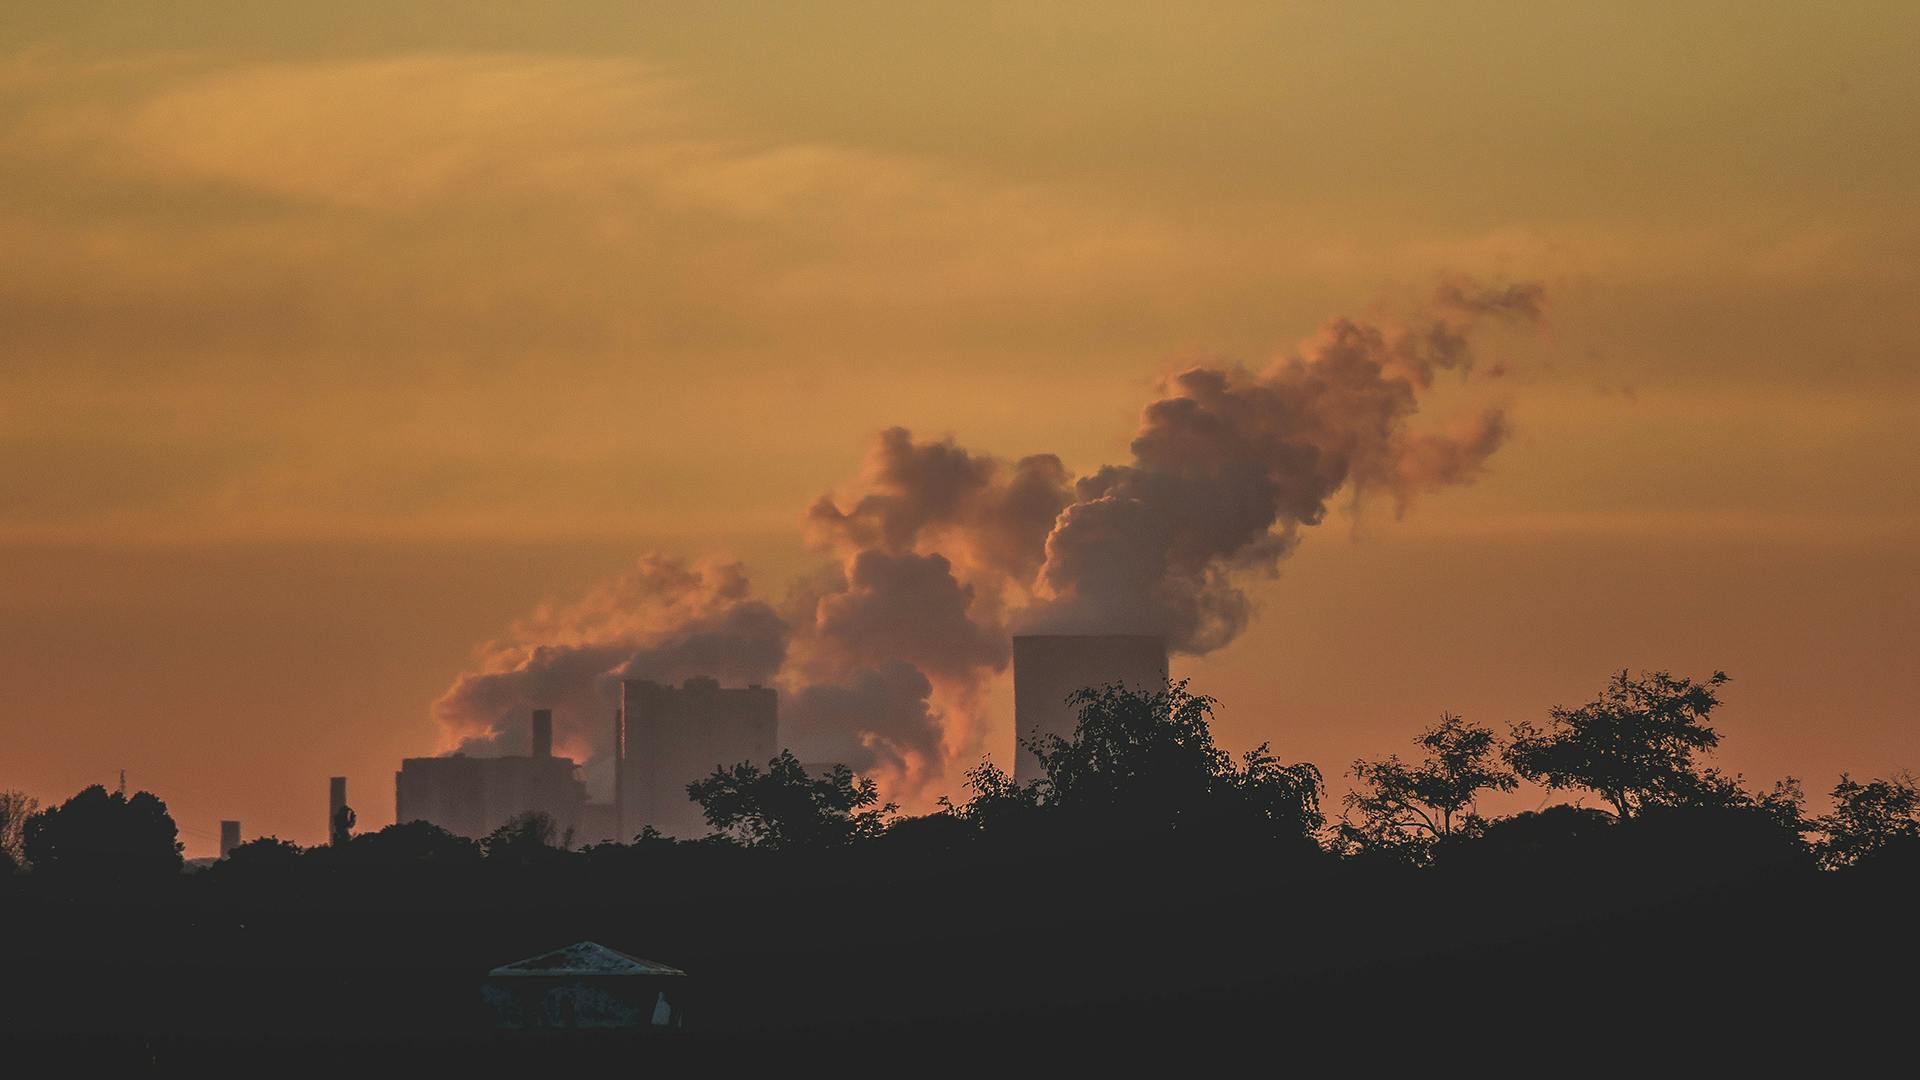
According to the World Health Organization (WHO), ambient air pollution kills an estimated 4.2 million people worldwide every year. A recent report estimated that exposure to air pollution is responsible for more deaths than road traffic injuries, malaria or malnutrition, and shortens the life of a child born today by almost two years. In the United States, a person is more likely to die from Covid-19 if they live in an area with high air pollution, including the many controversial “sacrifice zones” predominantly populated by low-income minorities.
During the pandemic, satellite images have shown a marked fall in particulate matter and other air pollutant levels as the slowdown in non-essential travel and industrial activity have improved the air quality in major cities around the world. When the immediate health crisis is over, how can cities respond to ensure that air pollution levels remain within sustainable ‘livable’ limits?
Before and after: Air pollution in major cities
The WHO sets an air quality threshold for particulate matter (PM 2.5), a common air pollutant that can trigger or worsen chronic respiratory diseases such as asthma, at 10 μg/m3. This threshold is close to the EPA Air Quality Index (AQI)’s classification of “Good” air quality, referring to air quality that is satisfactory and where pollution is at levels that pose little or no risk. If we compare the number of “Good” air quality days across several major cities in 2019 versus the period directly after lockdowns started to be introduced, we can see that “Good” days have overall increased while the number of more hazardous level days has decreased.

Source: Trucost Analysis (2020), plus Air Quality data from The World Air Quality Index Project
London and New York have experienced a higher percentage of “Good” days and a decrease in “Moderate” and “Unhealthy for Sensitive Groups” days, while Mumbai and Beijing have seen an increase mostly in “Moderate” days and decrease in the number of days with the worst air pollution. To keep the home countries of these cities within a sustainable “livable” air quality threshold, excluding the United States that already meets it, the annual average level of PM 2.5 would need to decrease by 0.5 μg/m3 in the United Kingdom, 81 μg/m3 in India and 43 μg/m3 in China.
A sustainable “livable” threshold
This “livable” threshold for air quality is stipulated by the WHO and is also included in the 2030 Sustainable Agenda under Goal 11: Sustainable Cities and Communities. As part of one of the targets under Goal 11, target 11.6 aims to “reduce the adverse per capita environmental impact of cities, including by paying special attention to air quality and municipal and other waste management, by 2030.” By tracking progress on air quality, target 11.6 can be used as a framework to gauge alignment with societal goals, such as healthy and sustainable cities.
Improving air quality means lowering pollution from traffic, manufacturing, and energy generation, but it is also helpful to look at how companies are providing solutions specific to air quality. Trucost analyzed its SDG company dataset composed of 3,500 companies and found that several companies are providing solutions specific to target 11.6, particularly in countries that are above the WHO air quality threshold, including China, Germany, the United Kingdom, Italy, Russia, India, Brazil, and Mexico.
Globally, if we look at where countries need the most investment on SDG 11 as it relates to air pollution, we see several countries in Africa, the Middle East, and Asia show up with the most need for addressing air quality. Niger, India, Saudi Arabia, and Egypt have some of the highest levels of air pollution. With only 8% of the world’s countries actually meeting the WHO threshold for good air quality, investment is needed in these high-risk areas but also in many more countries across the world.
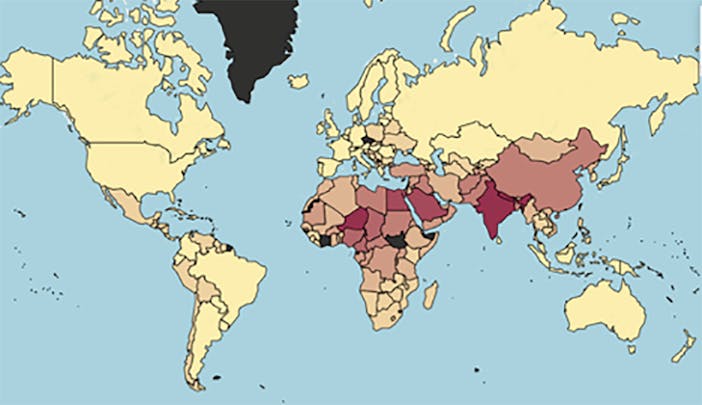
Source: SDSN Index (2019), PM2.5 values where red indicates the highest values and beige indicates the lowest. Countries with no data available are indicated in black.
How do we get there?
While improvements in air quality have been an unintended benefit of the pandemic, it should not be the reason we maintain clear skies. There are several ways cities could achieve and maintain a sustainable threshold for air pollution now and post Covid-19:
Reduce GHG emissions from employee commuting by increasing remote work. Trucost recently found that a 3-day work-from-home policy in the professional services sector could decrease emissions towards a sustainable threshold for the next five years.
Reduce business travel and replace it with more teleconferencing and virtual conferences. A 40% reduction in business travel could substantially decrease air pollution as well as align industries with a best-case climate scenario by 2030.
Transition vehicles and logistics infrastructure to low-carbon sources, such as electric vehicles and ocean freight. For electric vehicles, this would also mean investment in clean energy grids to supply power to these vehicles.
Reduce power generated by fossil fuels that have continued to emit air pollutants throughout the Covid-19 pandemic, and replace them with clean, renewable energy sources.
Localize supply chains to reduce transport distances and increase resiliency by having resources closer to where they are needed.
Innovate in industries that rely on travel, such as using virtual reality (VR) technology for virtual tourism.
Finally, invest in green infrastructures, such as green roofs and coastal parks, which not only improve air quality through vegetation but also can provide vital protection against storms.
The World Health Organization, (2020). Available at: https://www.who.int/airpollution/ambient/health-impacts/en/

IHME, (2019), State of Global Air 2019 Report. Available at: http://www.healthdata.org/news-release/state-global-air-2019-report

Wu, X et al. (2020), Exposure to air pollution and COVID-19 mortality in the United States: A nationwide cross-sectional study. Available at: https://www.medrxiv.org/content/10.1101/2020.04.05.20054502v2

Wired, (26th May 2020), Covid-19 Flares Up in America’s Polluted ‘Sacrifice Zones’. Available at: https://www.wired.com/story/covid-19-flares-americas-polluted-sacrifice-zones/

New York Times, (17th March 2020), Watch the Footprint of Coronavirus Spread Across Countries. Available at: (https://www.nytimes.com/interactive/2020/climate/coronavirus-pollution.html

US EPA, (2018), Technical Assistance Document for the Reporting of Daily Air Quality – the Air Quality Index (AQI). Available at: https://www.airnow.gov/sites/default/files/2020-05/aqi-technical-assistance-document-sept2018.pdf


